
How To Visually Spot Website Trends Using Google Analytics
Google Analytics is a great tool to determine how traffic is doing on your website. The various charts and graphs can give you a good idea of how traffic on your site is performing and where it’s coming from. But sometimes it can be tricky to spot specific sources of traffic spikes or issues. For example, let’s say you see a sudden spike in referral traffic but you’re not exactly sure which source is responsible. There are a few things you can do using Google Analytics to see this visually.
Finding Which Referral Source(s) Led To A Spike In Web Traffic
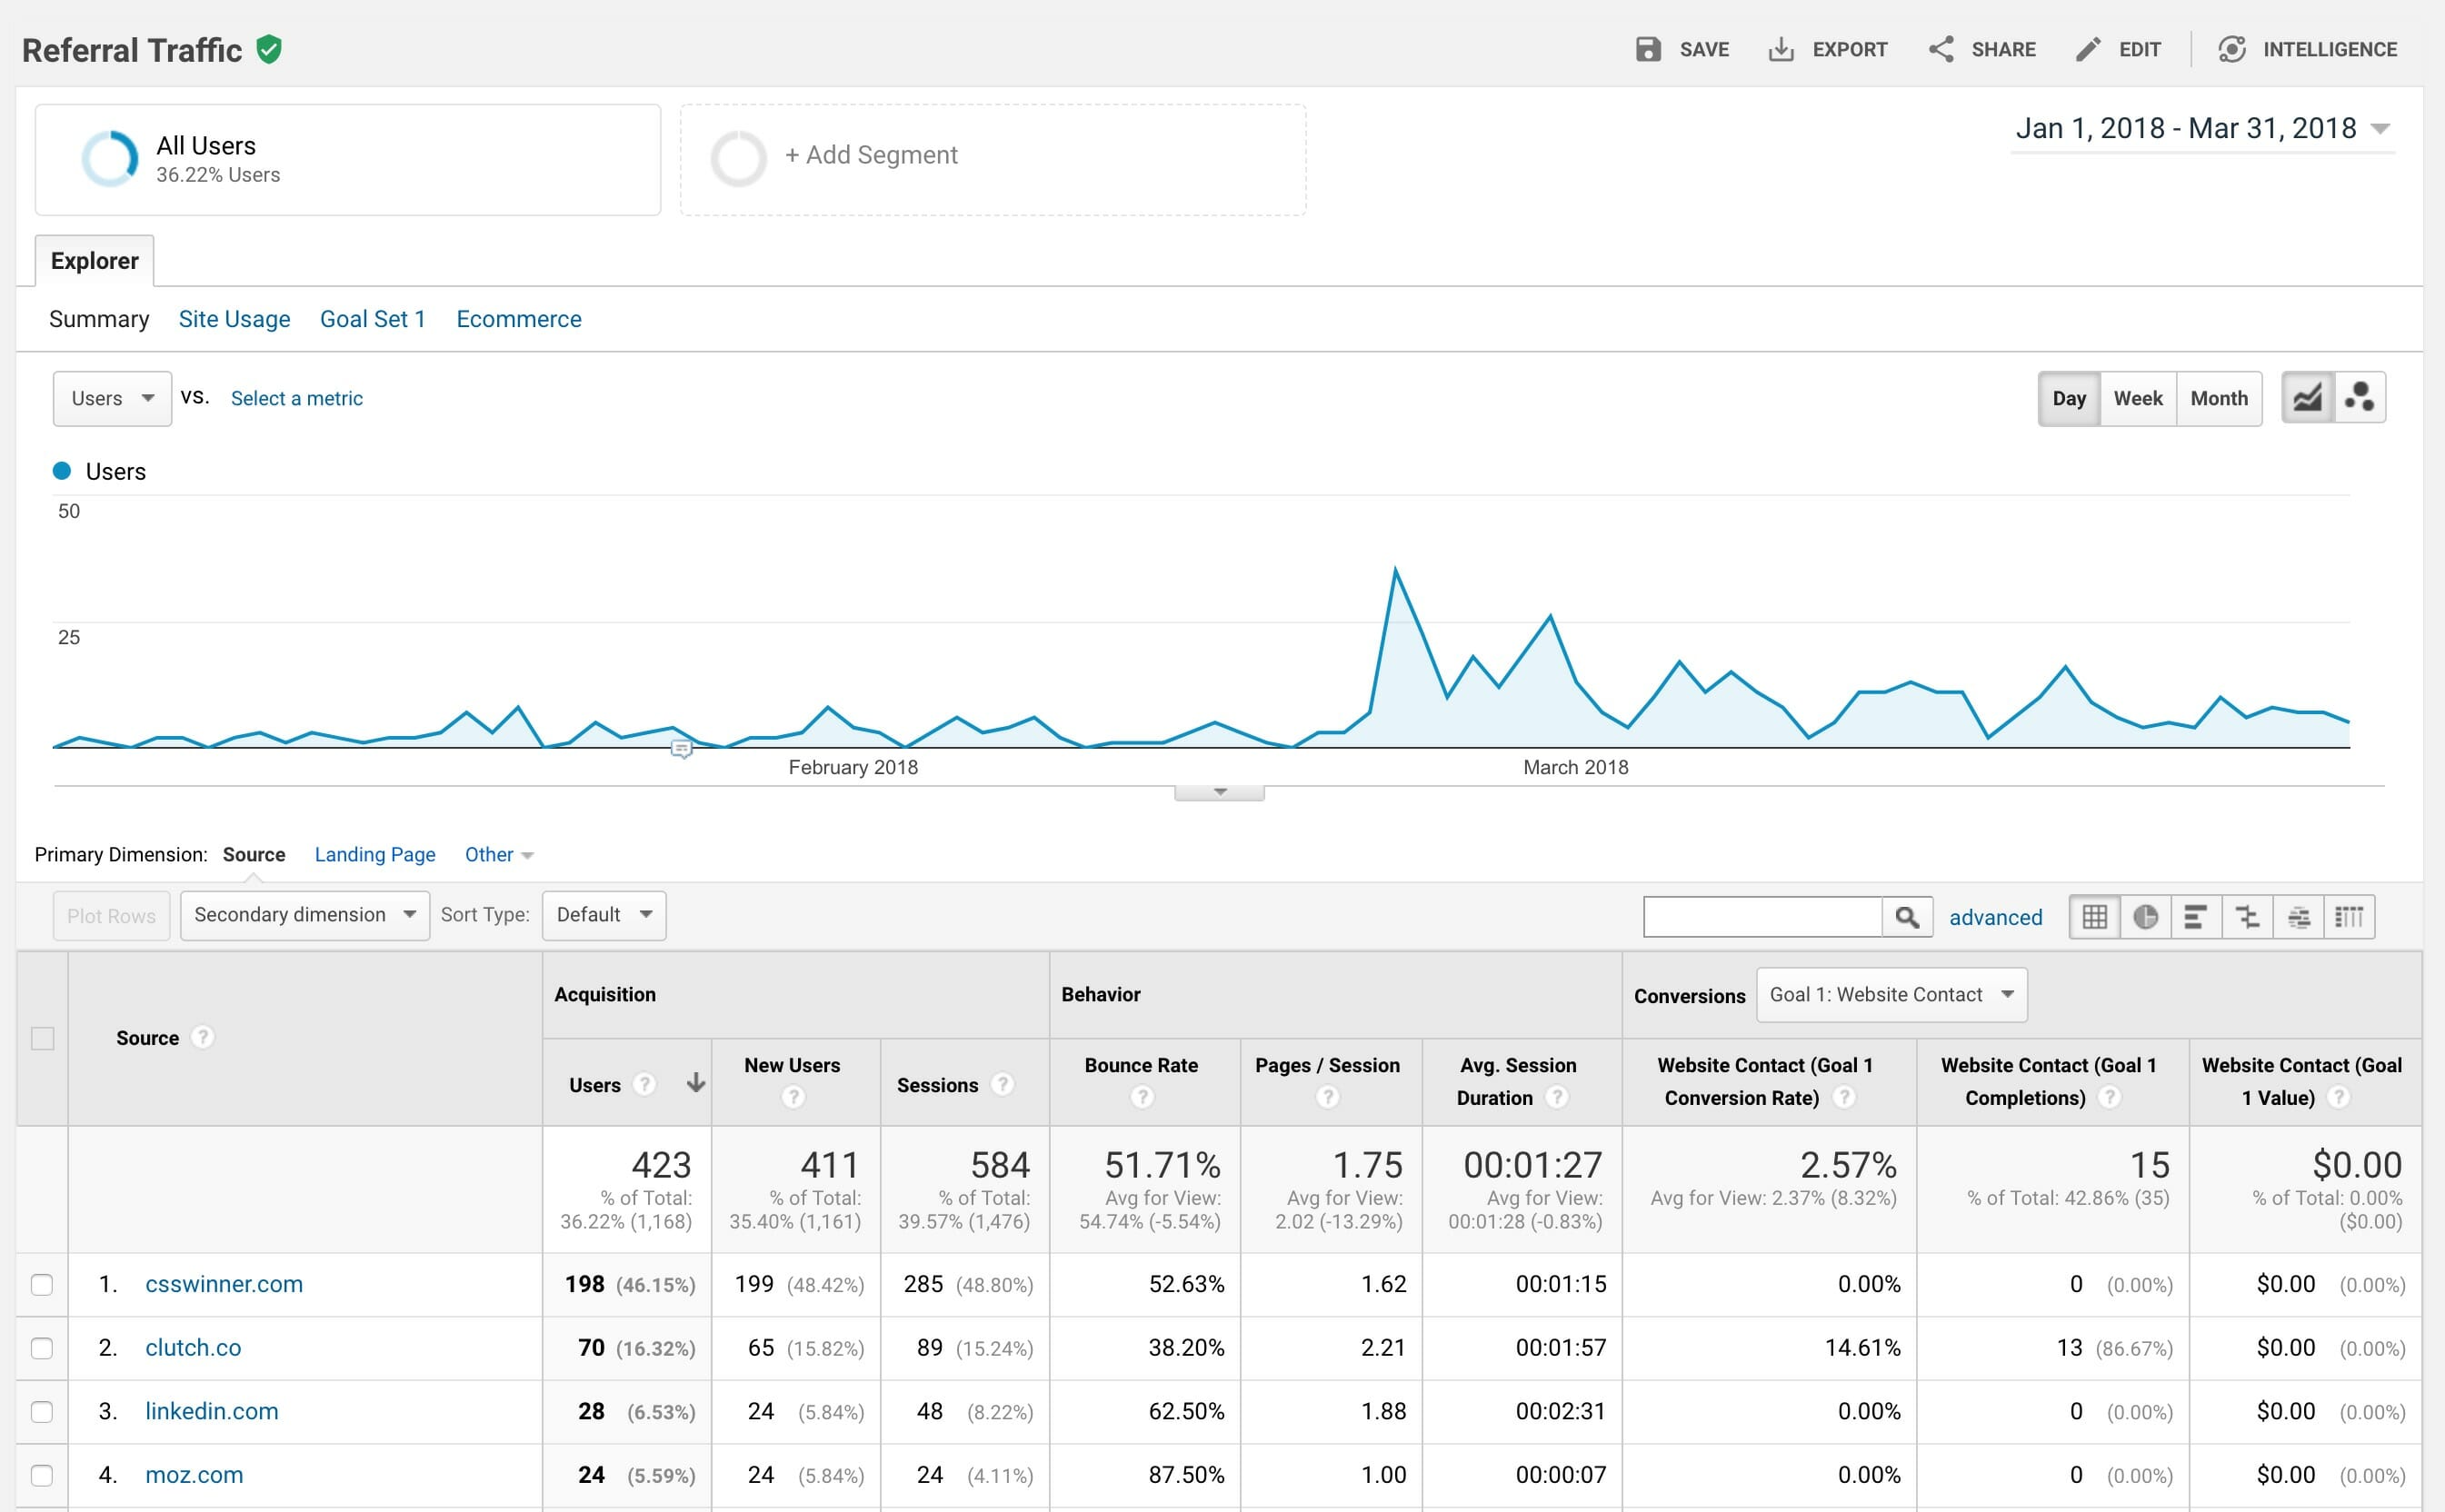
Let’s say you’re looking at your referral sources and you notice a day where you get a boost:
GOOGLE ANALYTICS CHART SHOWS A SPIKE IN REFERRAL TRAFFIC AROUND FEBRUARY 22ND, BUT IT’S NOT CLEAR WHICH SOURCE IS RESPONSIBLE FOR THE SPIKE.
The table below the chart shows the list of referring sites, but that doesn’t make it easy to specifically see what happened on February 22. Luckily, Google Analytics provides a couple of handy tools to see this visually. This process also applies to other channels such as organic or paid.
Plot Rows
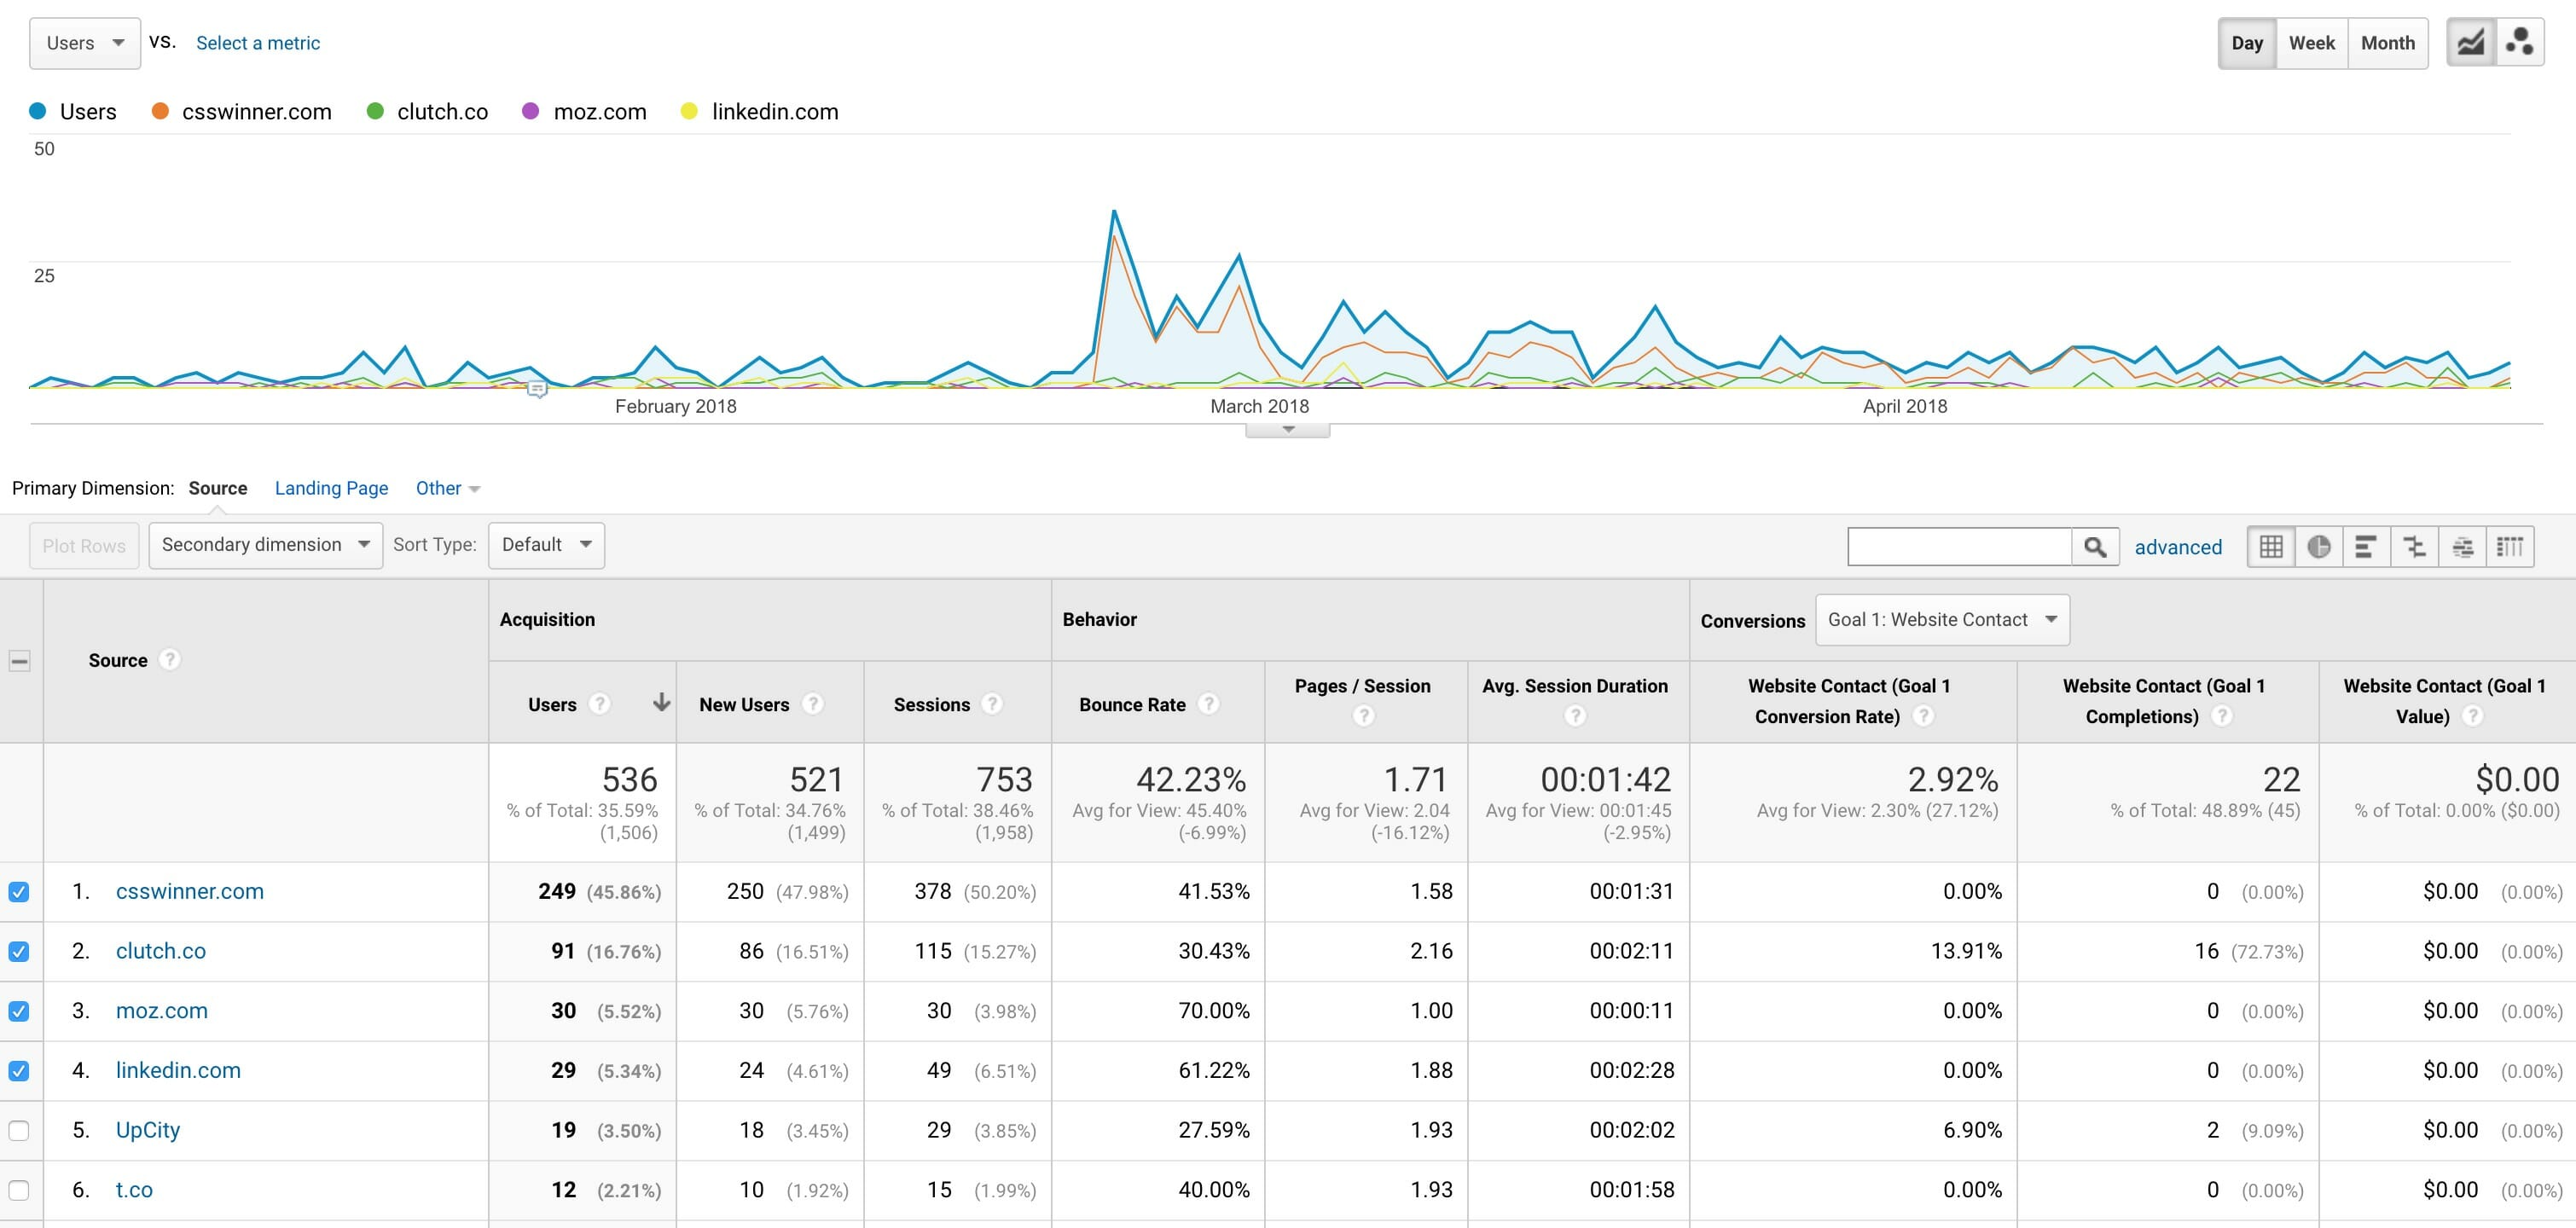
Plot Rows is great tool in Google Analytics that can help you visualize which of your sources correlate with your broader traffic trends.
THE PLOT ROWS TOOL IN GOOGLE ANALYTICS LETS YOU VIEW INDIVIDUAL REFERRAL SOURCES AGAINST YOUR OVERALL REFERRALS OVER TIME.
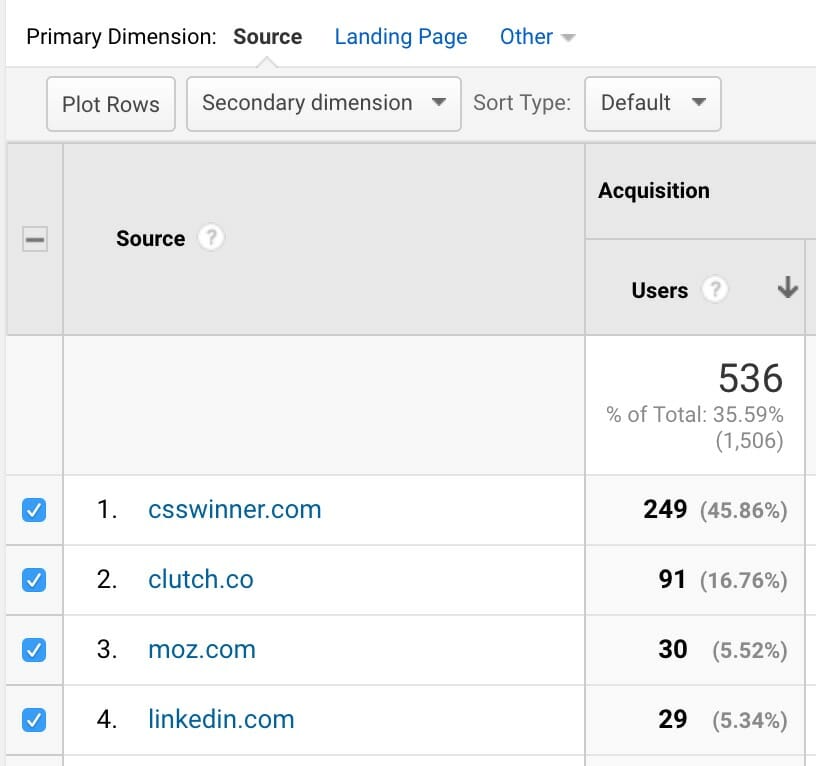
FIND THE PLOT ROWS TOOL IN GOOGLE ANALYTICS.
With the first few rows plotted using Plot Rows, we can see that the chart for csswinner.com closely resembles that of the overall referral traffic. This tells us that csswinner.com was responsible for the spike in traffic on February 22.
To find Plot Rows, click the checkmarks next to the referral sources you want to plot. Once you select at least one source, the Plot Rows button to the top-left of the table will appear.
Motion Charts (Flash Required)
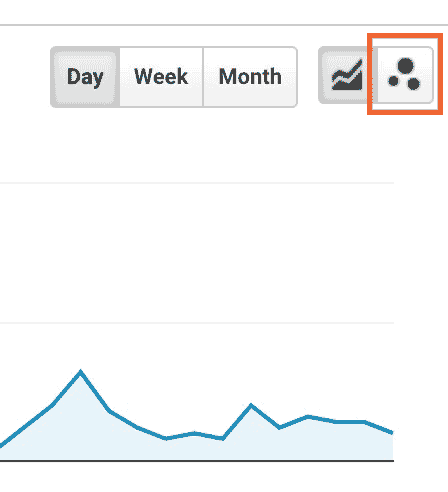
Another great way to find trends visually is using Motion Charts. Motion Charts in Google Analytics are a Flash-based animation that plots the referring sources over time. This can be a great way to watch when a spike in traffic occurs and which source was responsible. Here’s a brief video demonstrating how it works:
FIND THE MOTION CHARTS TOOL IN GOOGLE ANALYTICS
The beauty of Motion Charts is that now spikes in your data can be more obvious. If you watch the animation above, you’ll notice how one of the dots jumps to the top-right of the chart around February 22nd. If you pause the animation and hover over that dot, it will tell you which referral source is associated with that dot. Google Analytics also gives you a few handy controls so that you can change the speed of the animation (next to the Play button), or you can check off different sources so that labels appear next to those sources on the animation. (See checkboxes to the right).
Leverage These Visual Insights
Depending on the goals of your site, you might have different takeaways from the insights that you gain with these tools. Spikes in traffic that return back to normal aren’t necessarily the goal most sites would strive for because those traffic patterns don’t typically indicate engaged visitors. However, if you see a spike in traffic that leads to a new plateau in your referral traffic, you may want to analyze whether or not that new source is sending the right type of traffic to your website. Check your site to see which content led to the spike in traffic. It may help you make a more informed decision about future content marketing efforts, or it may give you ideas on repurposing old content.
